Infographics turns complex data into clear, engaging stories. At Peak Re, our charts, categorised by purpose or style, must be accurate and impactful. Follow our best practices to create effective visualisations.
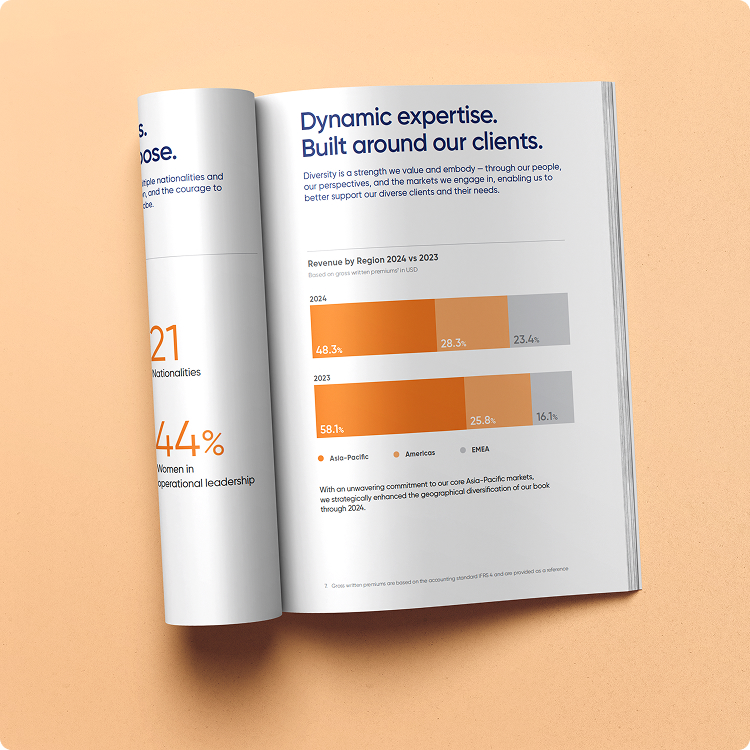
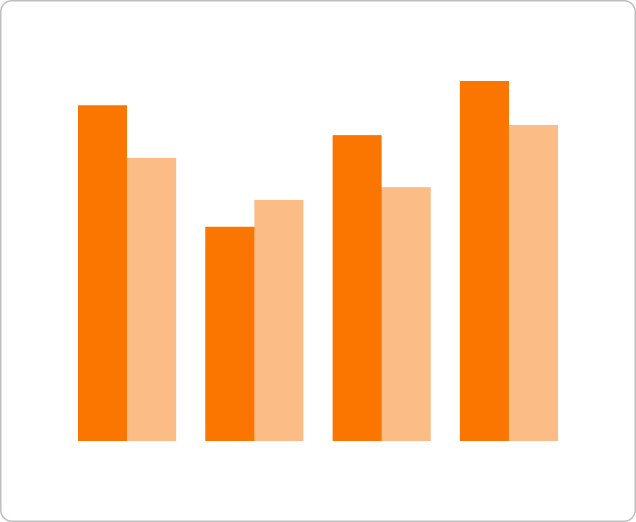
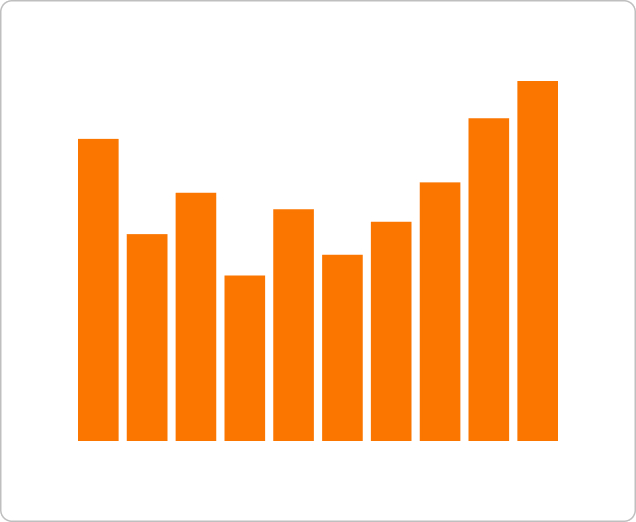
Comparison charts clearly display differences between elements. By placing visuals side-by-side, these charts simplify data comparison. They make insights immediately accessible, whether you're examining time-based data like daily sales or categorical information such as revenue by market.


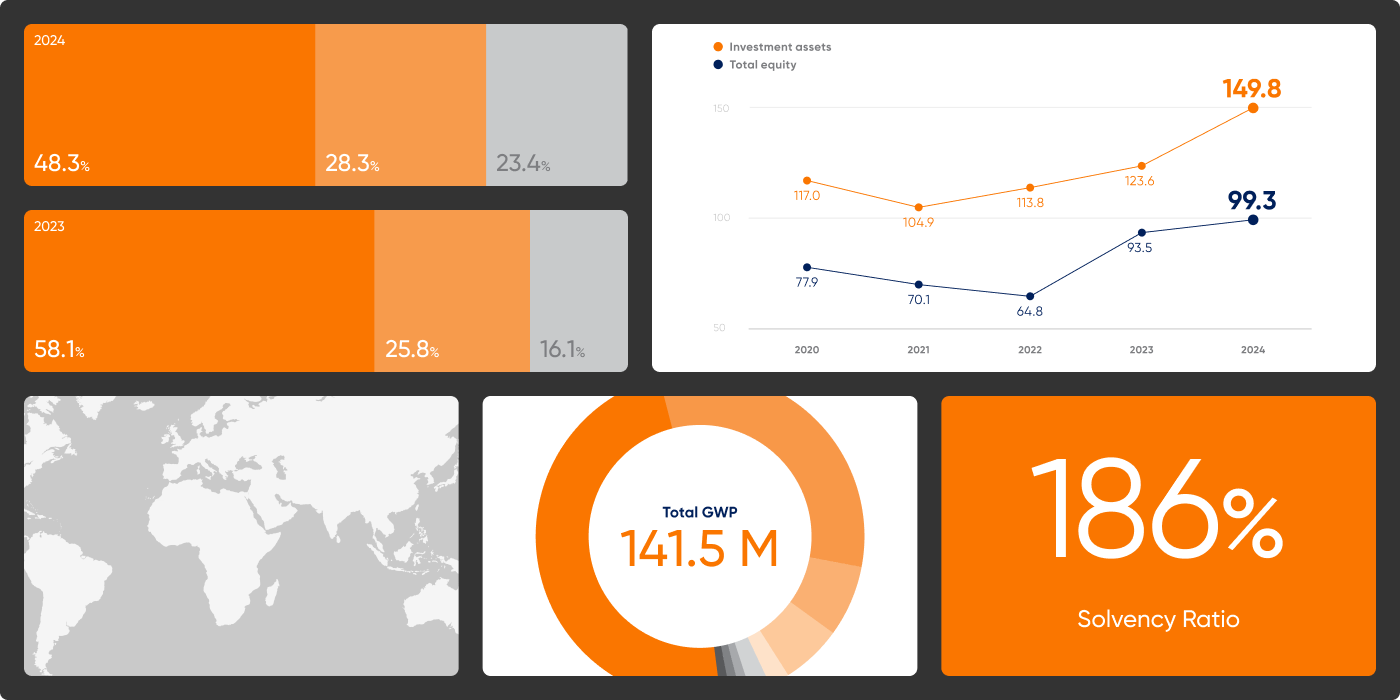
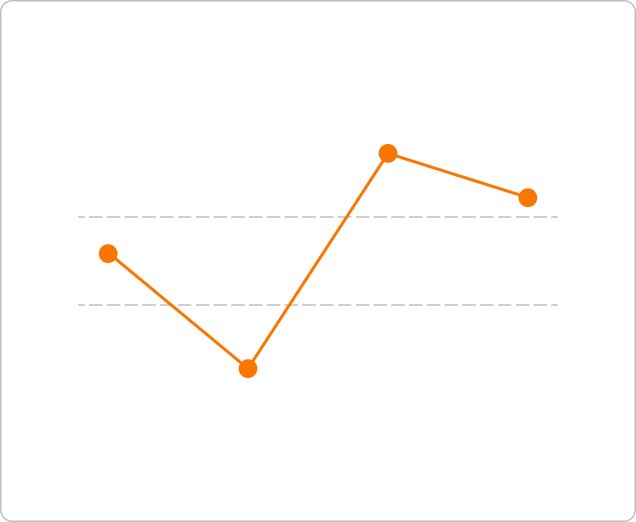
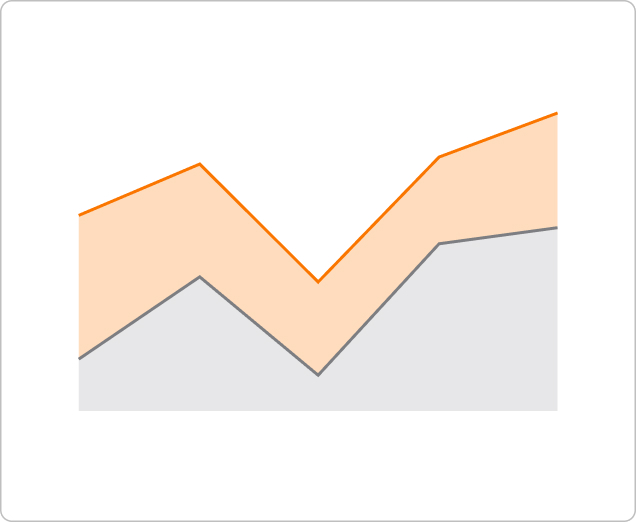
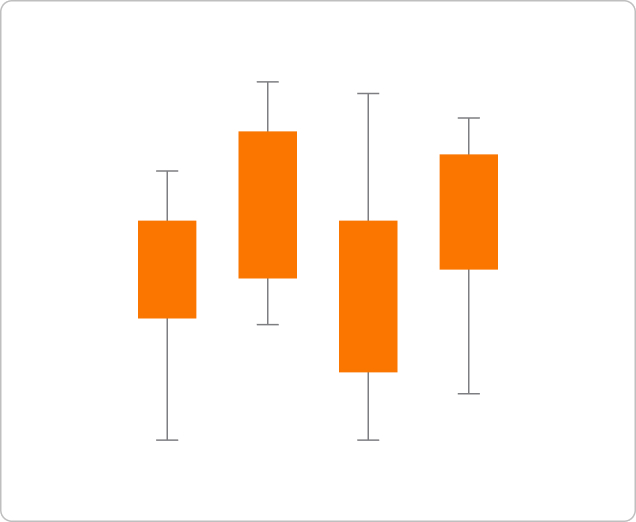
These visualisations are crucial for analysing data over time, enabling the tracking of changes across various durations. By illustrating value progression, they reveal patterns and fluctuations, offering insights into performance metrics like revenue growth. Their capacity to convey direction and momentum makes them valuable for strategic decision-making and forecasting in dynamic environments.
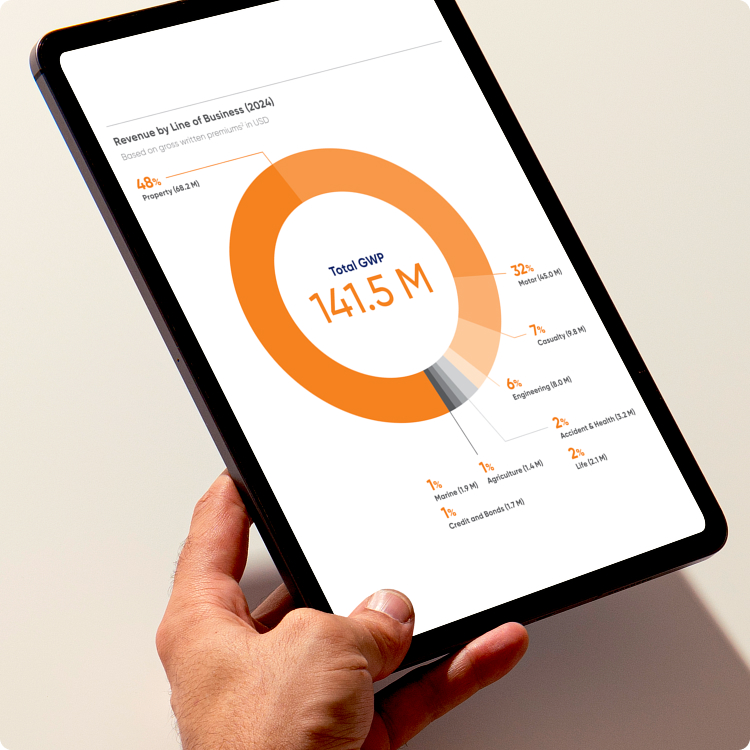
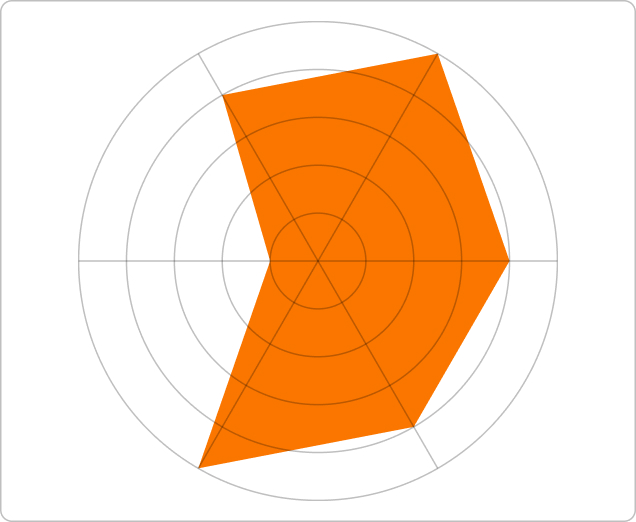
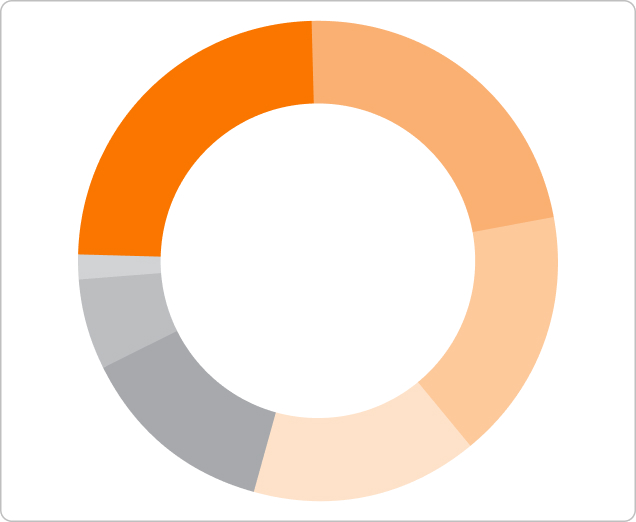
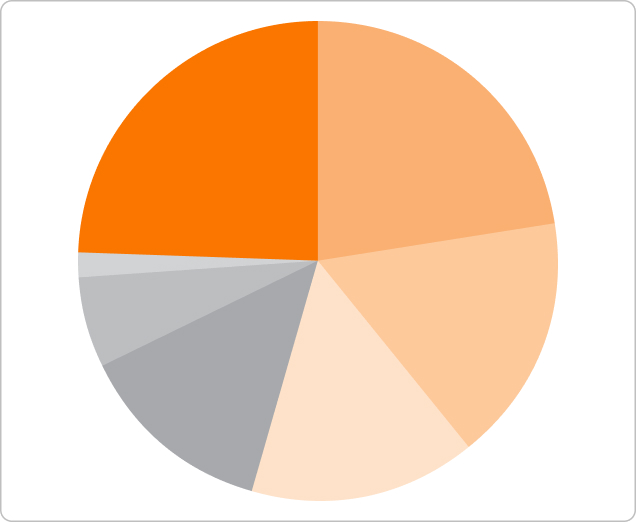
These charts visually depict the relationship between individual components and their total. Utilising formats like pie charts or stacked bar graphs, they illustrate the proportions of each segment, enhancing our understanding of data distribution. This approach is particularly effective for analysing financial allocations or market shares, providing clear insights into the composition of complex datasets.

Maps offer the most direct and intuitive method for communicating location-based insights. They empower users to instantly recognise areas and places, grasp the geographical context, and identify patterns, all by leveraging the positioning of elements.

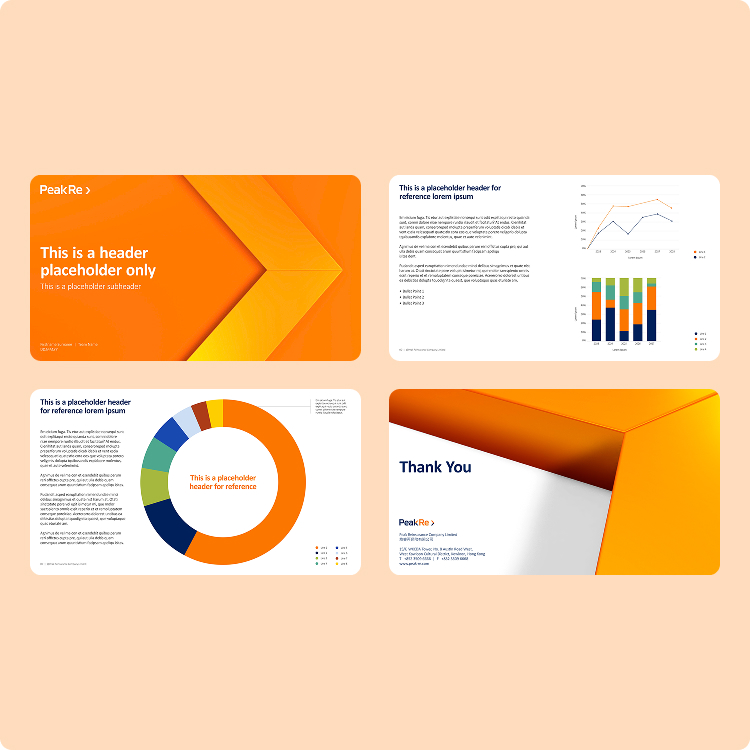
By translating our design philosophy into practical applications, these examples demonstrate how Peak Re's infographic style is seamlessly integrated into our publications across diverse touchpoints.